Graph IDE ► 3D Data Graphics ► Scatter
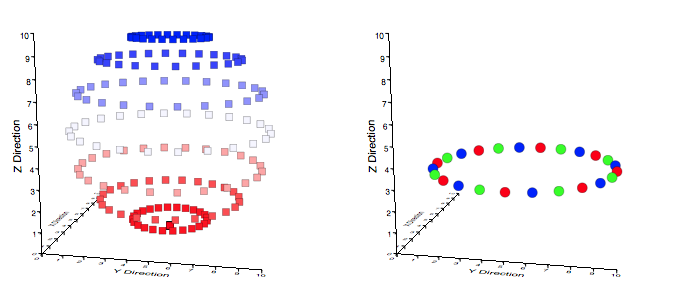
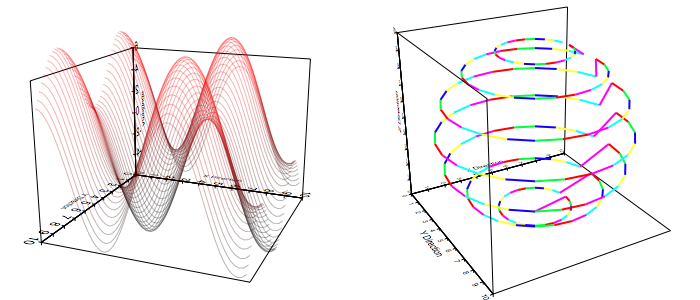
The 3D Scatter graphic represents a sequence of 3D points, examples of which are shown below. Notice that, with the appropriate graphical effects, the 3D points can represent a trajectory or a sequence of independent curves. In addition, with the appropriate colors, the 3D points can indicate separate data sets.
There should only be one 3D graphic per graph to maintain correct z-buffering and coloring is a way to show separate data sets while at the same time permit interleaving of the data sets within the projection.
Some standard operations are itemized below.
| Color Mapping Type (Applies to Markers Only) | |
| No Color Map | The color map is off. This makes most sense while just drawing the stroke so that only the trajectory appears. |
| False Color | The color is mapped from arbitrary independent values. Because there is no way to specify another independent value set this UI implementation maps from the z-values of the data. Programs can map from another basis. |
| Z-Value | The color is mapped from the z-value of the data points. This mapping is very common, albeit somewhat redundant because the data point z-values are already represented by 3d graph although a color mapping of this type is more quantitative because the projection mapping is not present in the color definition. |
| Distance | The color is mapped from a value related by the distance of the data point to the viewer. The distance is normalized so that the nearest and farthest points of data define the distance extremum. |
Data Editor
The Data Editor for the Point Map is shown below.
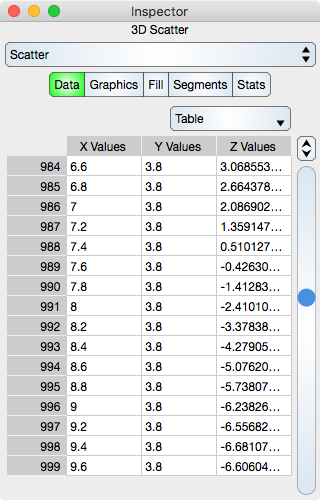
Table
Table controls are described in the Tables section.
The rows represent a 3D point while in atomic mode or x, y, z values in each respective cell while in component mode.
Graphics Editor
The Graphics Editor for the Point Map is shown below.

Common Controls
Controls common to all graphics are described in the Graphics section.
Color Map Attributes
The color map is further described in the Color Map section.
Graph : Shows a graph of the color map.
Legend : Shows a fill representation of the color map in both vertical and horizontal orientation. The independent variable of the graph (x-axis for horizontal and y-axis for vertical) is that of the scatter color interpretation. These legends can be dragged to the graphic view as needed. Since the legends are 2D Point Map graphics they can be independently altered once dragged to the graphic view.
Function : Select this to set the color map function. Typically it is set to linear.
Start Color : Defines the start Color of the color map.
End Color : Defines the end Color of the color map.
Number : Defines the number of samples in the color map.
Grid Attributes
Grid attributes are controlled by the normal stroke controls defined in the Graphics section.
Fill Editor
The Fill Editor for the 3D Scatter graphic is shown below.
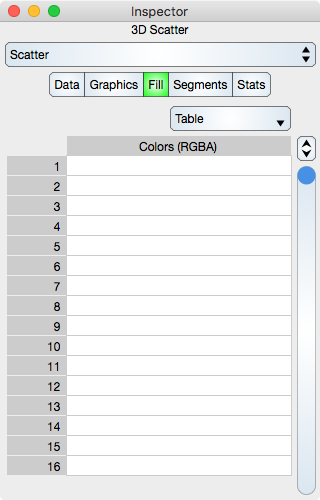
Fill attributes is a false color table of RGBA components, one for each point. These can be overridden by the Color Interpretation setting and that setting must be False Color Map in order for the elements of this table to take effect. Notice that this table is the same values presented in the Point Tags Colors editor.
Table
Table controls are described in the Tables section.
The rows represent a segment color values. While in Atomic mode, the cell represents a rgba value and while in component mode the cell represents either single r, g, b and a. Hence, in atomic mode there is one column while in component mode there are four columns.
Note that if the Data sequence is changed then the Fill sequence will not change.
Segments Editor
The Segments Editor for the 3D Scatter graphic is shown below.
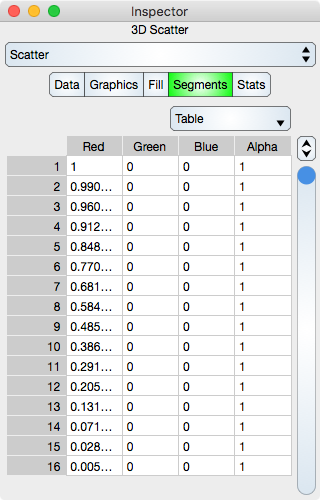
Segments are the line segments interpolated between each 3D point. See Sequence Colors for additional information. A transparent color can be used to define an unconnected segment and then the data points can appear to be independent curves which represent separate data sets.
Table
Table controls are described in the Tables section.
The rows represent a segment color values. While in Atomic mode, the cell represents a rgba value and while in component mode the cell represents either single r, g, b and a. Hence, in atomic mode there is one column while in component mode there are four columns.
Note that if the Data sequence is changed then the Segments sequence will not be change.
Stats Editor
The Stats Editor for the Scatter graphic is shown below. Note that each X, Y and Z statistic is an orthographic statistic, i.e.: That value that is the statistic on the respective graph planes.
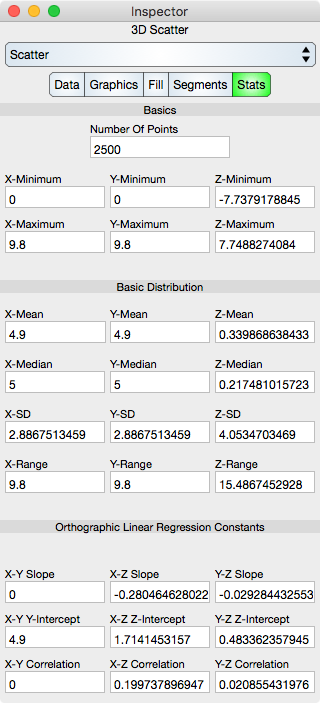
Basics
Number Of Points : Shows the number of points in the Scatter.
X-Minimum : x-minimum value of all the data points.
Y-Minimum : y-minimum value of all the data points.
Z-Minimum : z-minimum value of all the data points.
X-Maximum : x-maximum value of all the data points.
Y-Maximum : y-maximum value of all the data points.
Z-Maximum : z-maximum value of all the data points.
Basic Distribution
The basic distribution is shown separately for the x, y and z dimensions.
Mean : Shows the mean of the data.
Median : Shows the median of the data.
Standard Deviation : Shows the standard deviation of the data.
Range : Shows the range of the data (maximum - minimum).
Linear Regression Constants
Note that linear regression may also be referred to as line fit.
Slope : Shows the slope of the linear regression.
Y-Intercept : Shows the y-intercept of the linear regression.
Correlation : Shows the correlation constant of the linear regression.