Graph IDE ► Draw Attributes ► Color Map
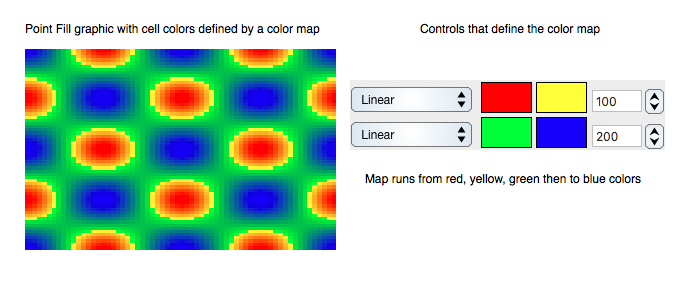
Color Map Draw Attributes define a gradient of colors related to the data values of a graphic. Color maps can add another dimension to the data representation or they can augment the representation of an existing dimension. The figure below is an example of a color map for the Point Map data graphic. The color gradient represents a hypothetical z-dimension in an otherwise x and y dimension coordinate representation.
All data graphics can potentially support at least one if not more color mappings. The data graphics that presently support color mappings are the Point Map, 3D Point Map, 3D Scatter graphics. The present color mapping is a gradient mapping in that the gradient does not necessarily have a one to one relationship with the data.
Attributes
The interpretation of a color map is specific to each data graphic. However, in the current implementation, a color map defining attributes (control parameters) are listed here:
The color mapping is a contiguous split-domain mapping. The following figure shows that mapping function for the parameters shown in the example point fill graphic above.
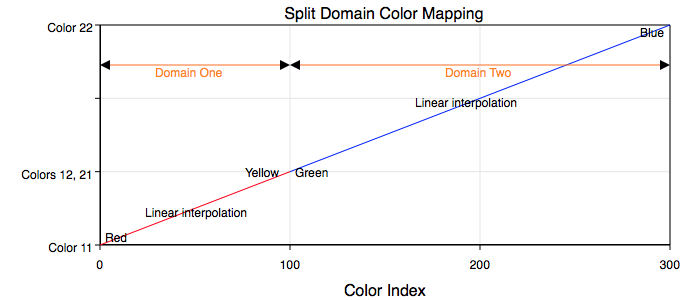
Domain one has 100 color sections that map the minimum data value to red and the data value 1/3 the way between minimum and maximum to yellow. It then maps the next data value to green and the maximum data value to blue. Between those control values it linearly interpolates the color values. The following defines the parameters for one of those color mapping domains:
Number Of Colors: Defines the number of colors in the domain.
First Color: The color of the domain's minimum data value.
Second Color: The color of the domain's maximum data value.
Interpolation: The curve profile of the color interpolation between the first and seconds colors. This is one of constant linear, quadratic or inverse quadratic.
By defining the first domain as a quadratic interpolation and the second domain as an inverse quadratic interpolation the resulting combined mapping profile is smooth. If either domain has interpolation of constant then there will only be a single color in the data range of that domain. Implicit in the definition is the fact that the number of colors in each domain are proportionally related to the data value interval of that domain. For example, if the first domain number of colors is zero then all colors are mapped by domain two. If the number of colors of each domain is the same then each domain is exactly half of the data value range, i.e.: from {minimum to (maximum + minimum)/2} and then from {(maximum + minimum)/2 to maximum}.
By defining domain-1-maximum value equal to domain-2-minimum value the mapping profile will be continuous. Otherwise it will be disjoint. A disjoint profile is desirable if the discontinuity is relevant to the associated data value.